POWER SUPPLY
JOBS & TECHNOLOGY
ISSUE: September 2009
|
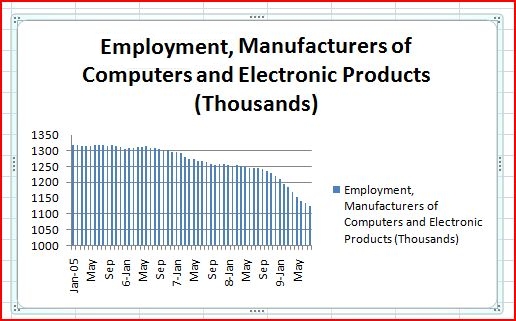
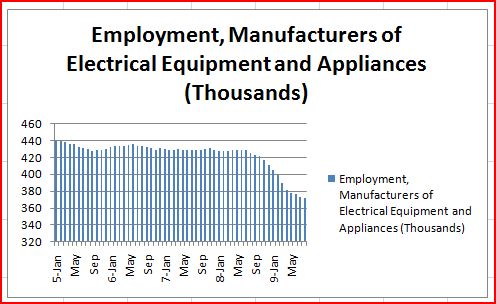
U.S. Employment Trends in Select Manufacturing Segments Using data available at the U.S. Department of Labor’s Bureau of Labor Statistics website (http://www.bls.gov/CES/ ), I graphed the employment trends in select manufacturing categories and subcategories since January 2005. A quick glance at the graphs, gives you a sense of how U.S. employees within these industries have fared in recent years. Note that the numbers of jobs are given in thousands and include all employees of the companies within a given category or subcategory.
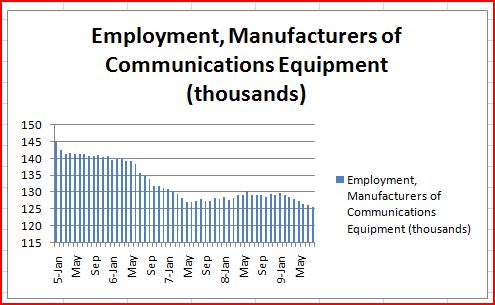
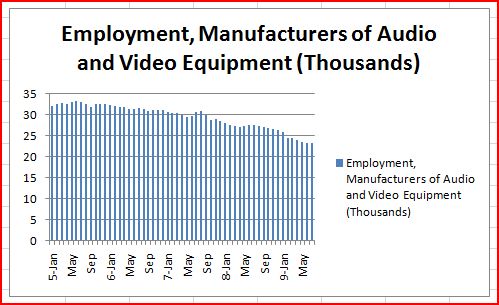
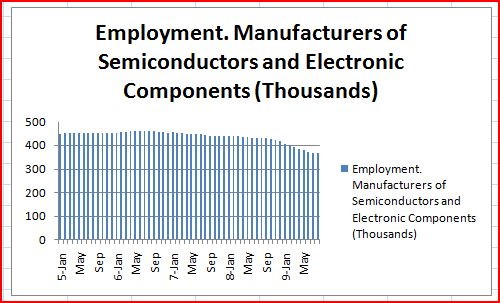
The Manufacturers of Computers and Electronic Products (NAICS code 334) are further classified within the following subcategories for which I have gathered similar data:
As you can see from the above graphs, there has been much variation in the employment trends for the different subcategories within Computers and Electronic Products. Another category that’s worth looking at is employment among manufacturers of electrical equipment, appliances and components (NAICS code 335). Although, not shown here, it may be interesting to see how the light equipment manufacturers have fared in recent years versus the appliance manufacturers.
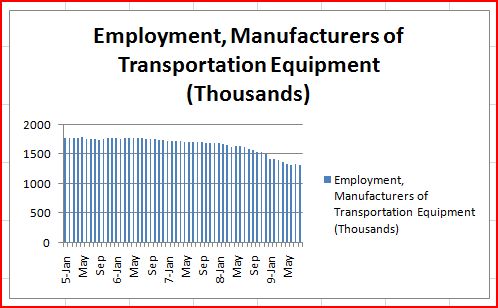
Trends in employment for manufacturers of transportation equipment is also of interest:
Much of the steep dropoff in the above employment figures is probably due to the recent decline in motor vehicle manufacturing:
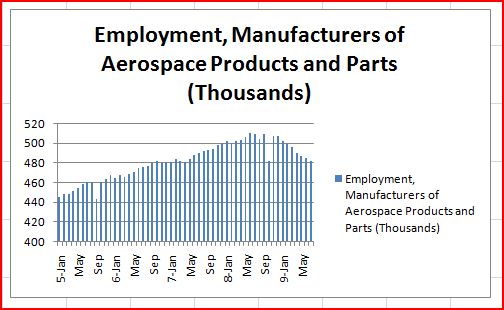
Note that there are actually multiple NAICS subcategories related to motor vehicle manufacturing. The graph below shows a very different multi-year trend for employment among aerospace equipment makers.
In aerospace, employment had been trending up until late in 2008. And the decline since then has not been as severe as in other manufacturing areas. |

